OSU INAM Features and Visualization Capabilities
- The OSU InfiniBand Network Analysis and Monitoring tool - OSU INAM monitors IB clusters in real-time by querying various subnet management entities in the network.
- New features and enhancements compared to OSU INAM 1.0 release are marked as (NEW) .
- Major features of the OSU INAM tool include:
- Analyze and profile network-level activities with many parameters (data and errors) at user-specified granularity
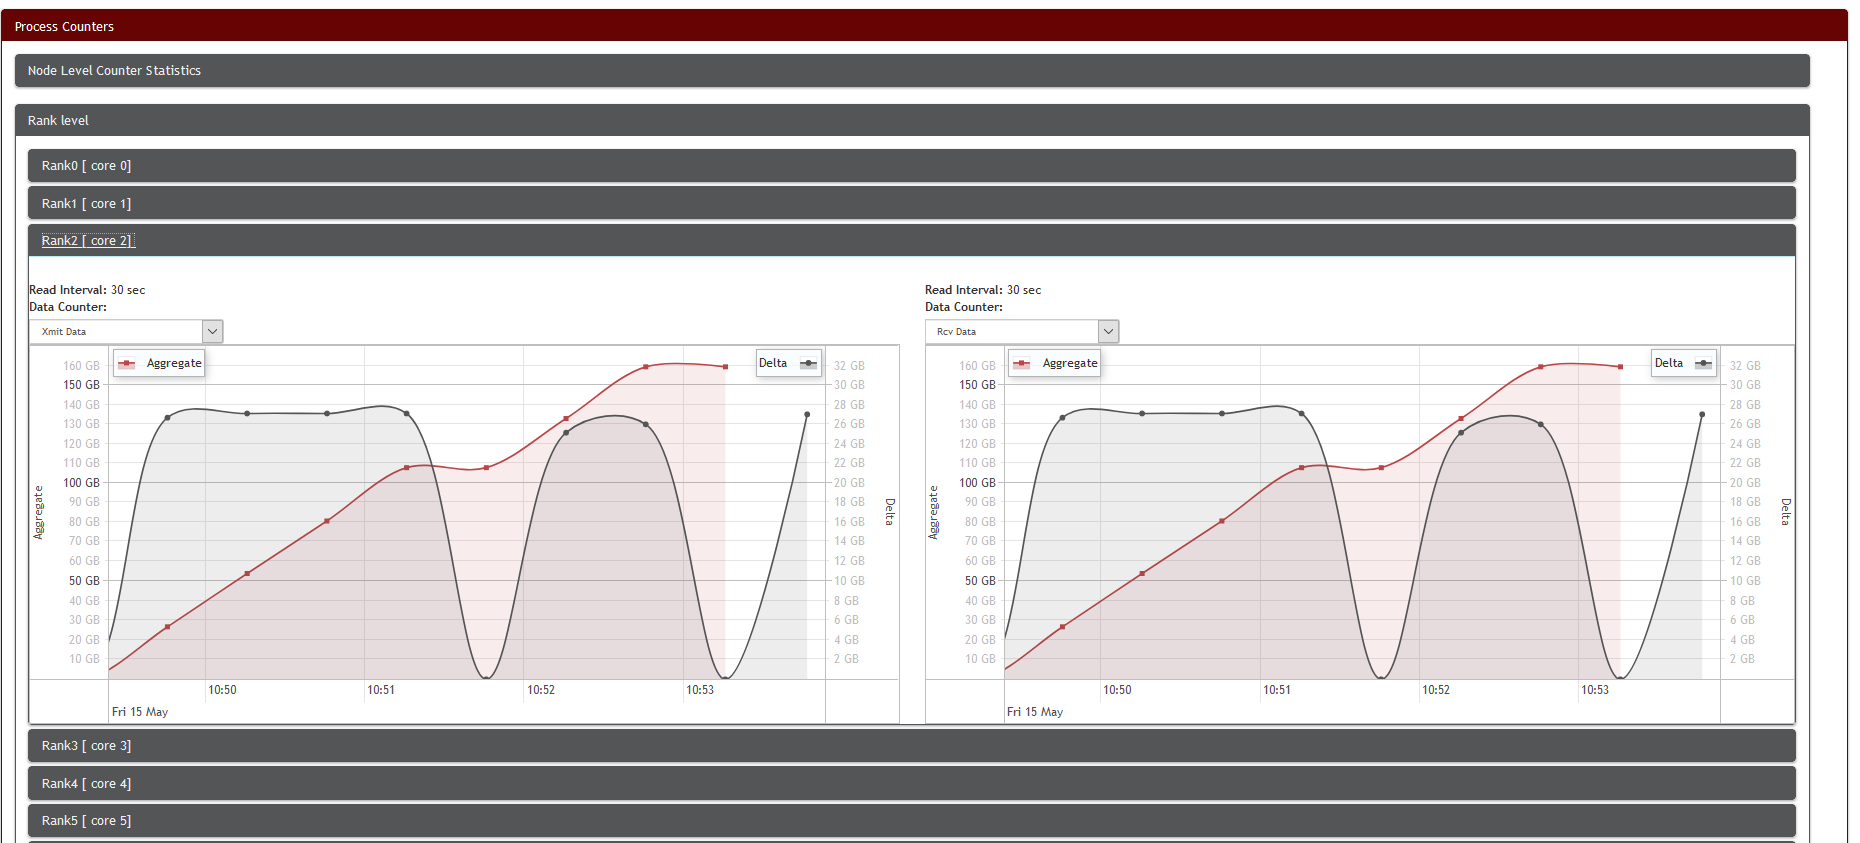
- Capability to analyze and profile node-level, job-level, and process-level activities for MPI communication (Point-to-Point, Collectives and RMA) in conjunction with MVAPICH2-X
- Capability to profile and report the following parameters of MPI
processes at node-level, job-level, and process-level at user-specified
granularity in conjunction with MVAPICH2-X for live and historical jobs
- CPU Utilization
- Memory Utilization
- Inter-node communication buffer usage for RC transport
- Inter-node communication buffer usage for UD transport
- Support for InfiniBand port counters in live jobs page, live nodes page, historical jobs, and historical nodes pages
- Support for PBS and SLURM job scheduler
- (NEW) Ability to gather InfiniBand performance counters at sub-second granularity for very large (>20,000 nodes) clusters
- Support for adding user-defined labels for switches to allow better readability and usability
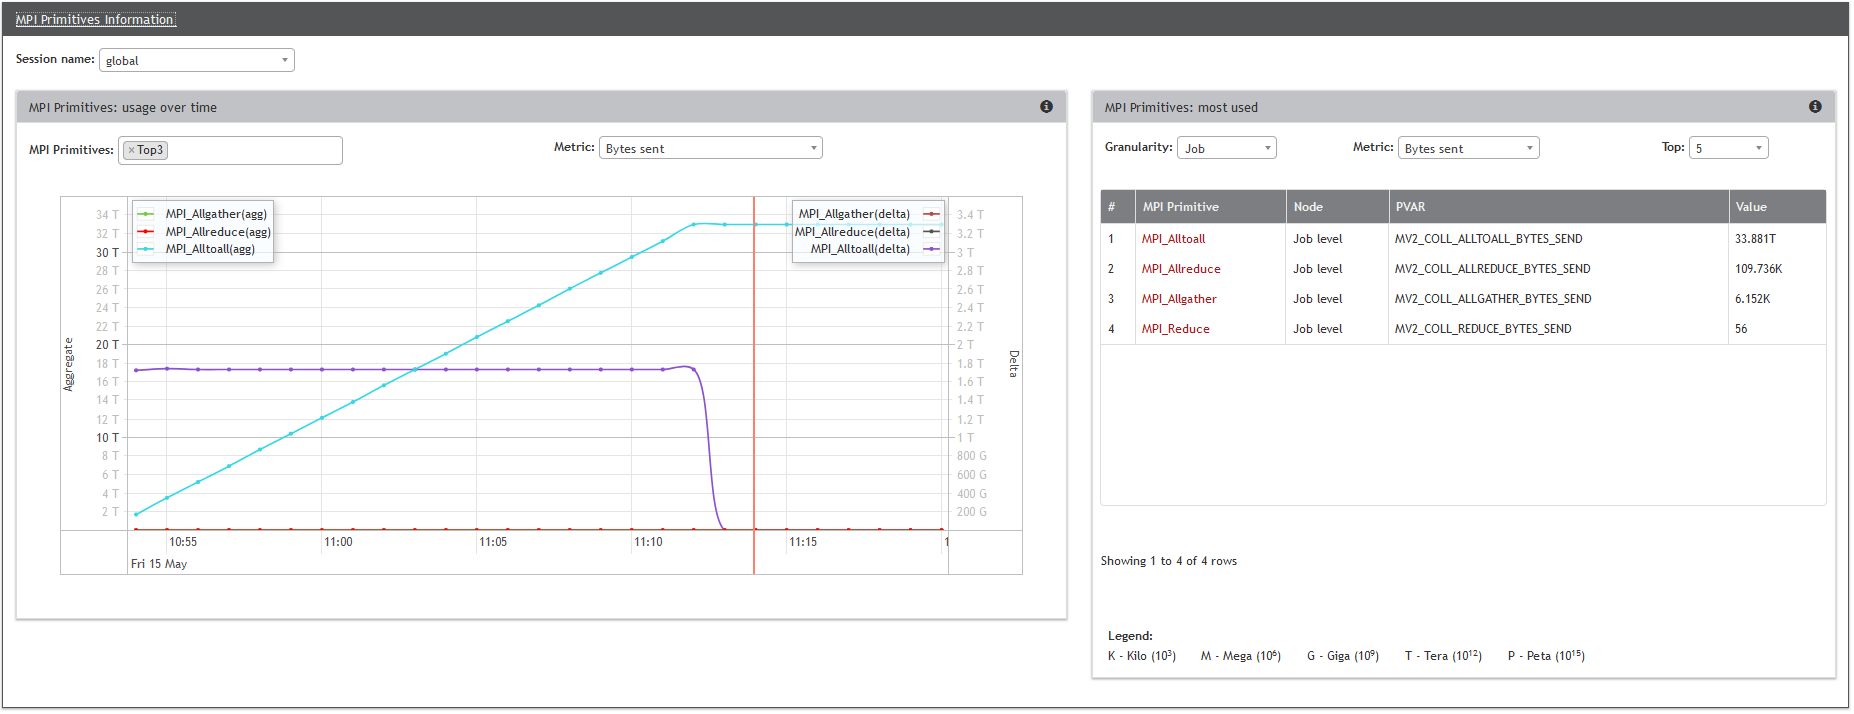
- Support to collect and visualize MPI_T based performance data
- Ability to collect and display "most used" MPI primitives at Node, Job, and Cluster granularities
- Ability to collect and display MPI_T based performance data for each MPI primitive for different message ranges at Node and Job granularities (live and history view).
- Ability to classify blocking and non-blocking data transfers for different message ranges at Node and Job granularities (live and history view).
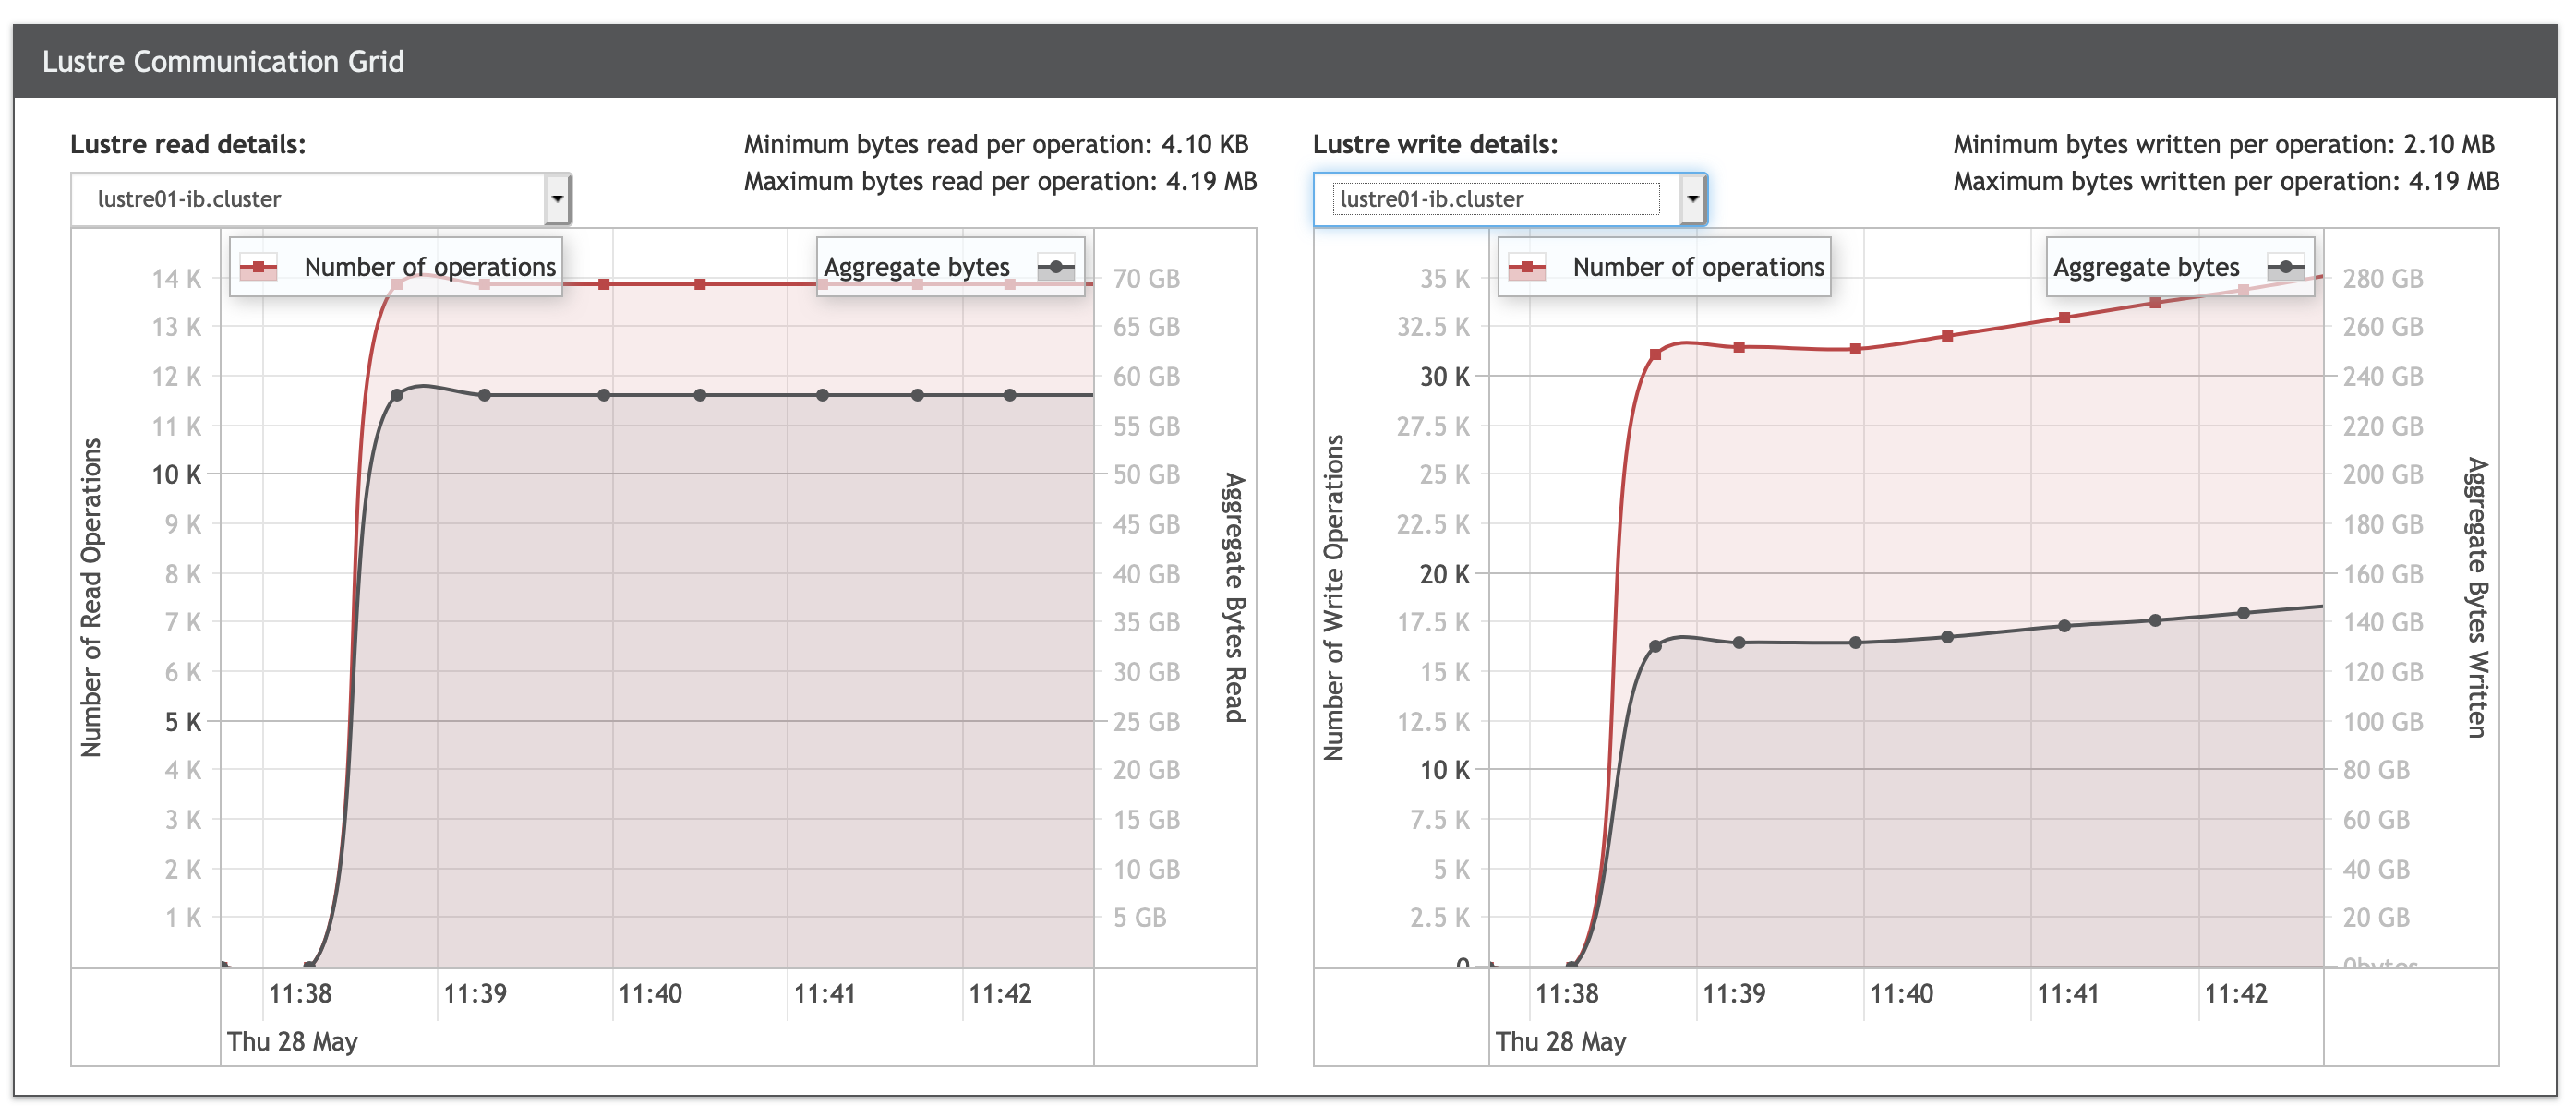
- Ability to gather and display Lustre I/O for MPI jobs at Node, Job and Cluster granularities (live and history view)
- Enable emulation mode to allow users to test OSU INAM tool in a sandbox environment without actual deployment
- Generate email notifications to alert users when user-defined events occur
- Ability to select PBS/SLURM job schedulers at runtime
- (NEW) Support for ClickHouse Database to support real-time querying and visualization of very large HPC clusters (20,000+ nodes)
- (NEW) Support for up to 64 parallel insertion for multiple sources of profiling data
- (NEW) Support for up to 64 concurrent users to access OSU INAM with sub-second latency by using ClickHouse
- (NEW) Improved stability of OSU INAM operation
- (NEW) Reduced disk space by using ClickHouse
- (NEW) Change Default Bulk Insertion Size based on Database used to improve real-time view of network traffic
- (NEW) Extending notifications to support multiple criteria
- Support for data loading progress bars on the UI for all charts
- Enhanced the UI APIs by making asynchronous calls for data loading
- Improved stability of INAM daemon
- Support for MySQL and InfluxDB as database backends
- Enhanced database insertion by using InfluxDB
- MPI_T Performance Variables (PVARs)
- Fabric topology
- Infiniband port data counters and errors
- Support for continuous queries to improve visualization performance
- Support for SLURM multi-cluster configuration
- Significantly improved database query performance when using
InfluxDB resulting in improvements for the following:
- Live switch page
- Live node page
- Live jobs page
- Historic node pages
- Historic jobs pages
- Historic switch pages
- Significantly improved page load performance for
- Live switch page
- Live jobs page
- Live nodes page
- Live link information page
- Historic job pages
- LHistoric node pages
- Support for refreshing charts when zooming in and out on the historic switches page
- Support to show the number of data points found for an InfiniBand switch counters and taken time to fetch them for each port in the historic switch page
- Enhanced debugging, error reporting, and logging capabilities on OSU INAM web-based user interface
- Enhanced stability and performance in emulator mode
- Support authentication for accessing the OSU INAM webpage
- Optimized historical replay of the network view to yield quicker results
- Support to view connection information at port level granularity for each switch
- Support to search switches with name and lid on historical switches page
- Support to view information about Non-MPI jobs in the live node page
- Stabilized rendering of the live network view
- Support for interpolation of process and port counters charts in live job page
- Support for MOFED => 4.9
- Display "no data" for fields that have no data to display
- Enhanced INAMD to query end nodes based on command line option
- Enhanced interaction between web application and SLURM job launcher for increased portability
- Enhanced performance for fabric discovery using optimized OpenMP-based multi-threaded designs
- Significant enhancements to the user
interface to enable scaling to clusters with thousands of nodes
- Network view - RI2 cluster @ OSU
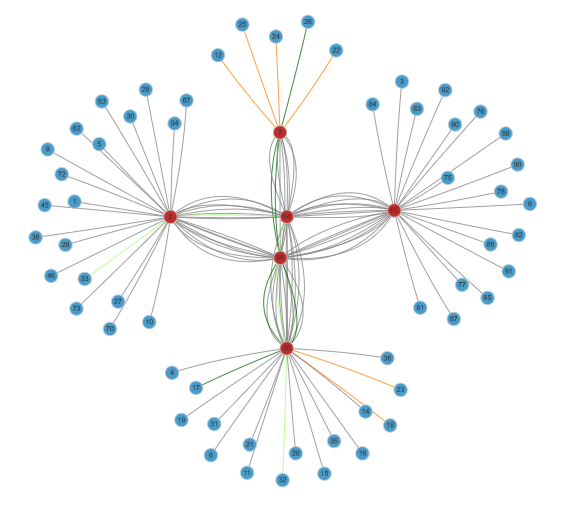
Network view of RI2 cluster - 58 nodes, 6 switches, 189 links
- Network view - OSC HPC clusters
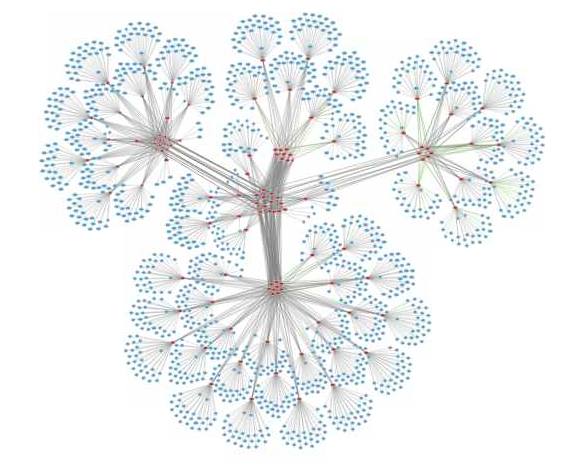
Network view of OSC cluster - 1,633 nodes, 109 switches, 3,583 network links
- Network view - Frontera HPC cluster
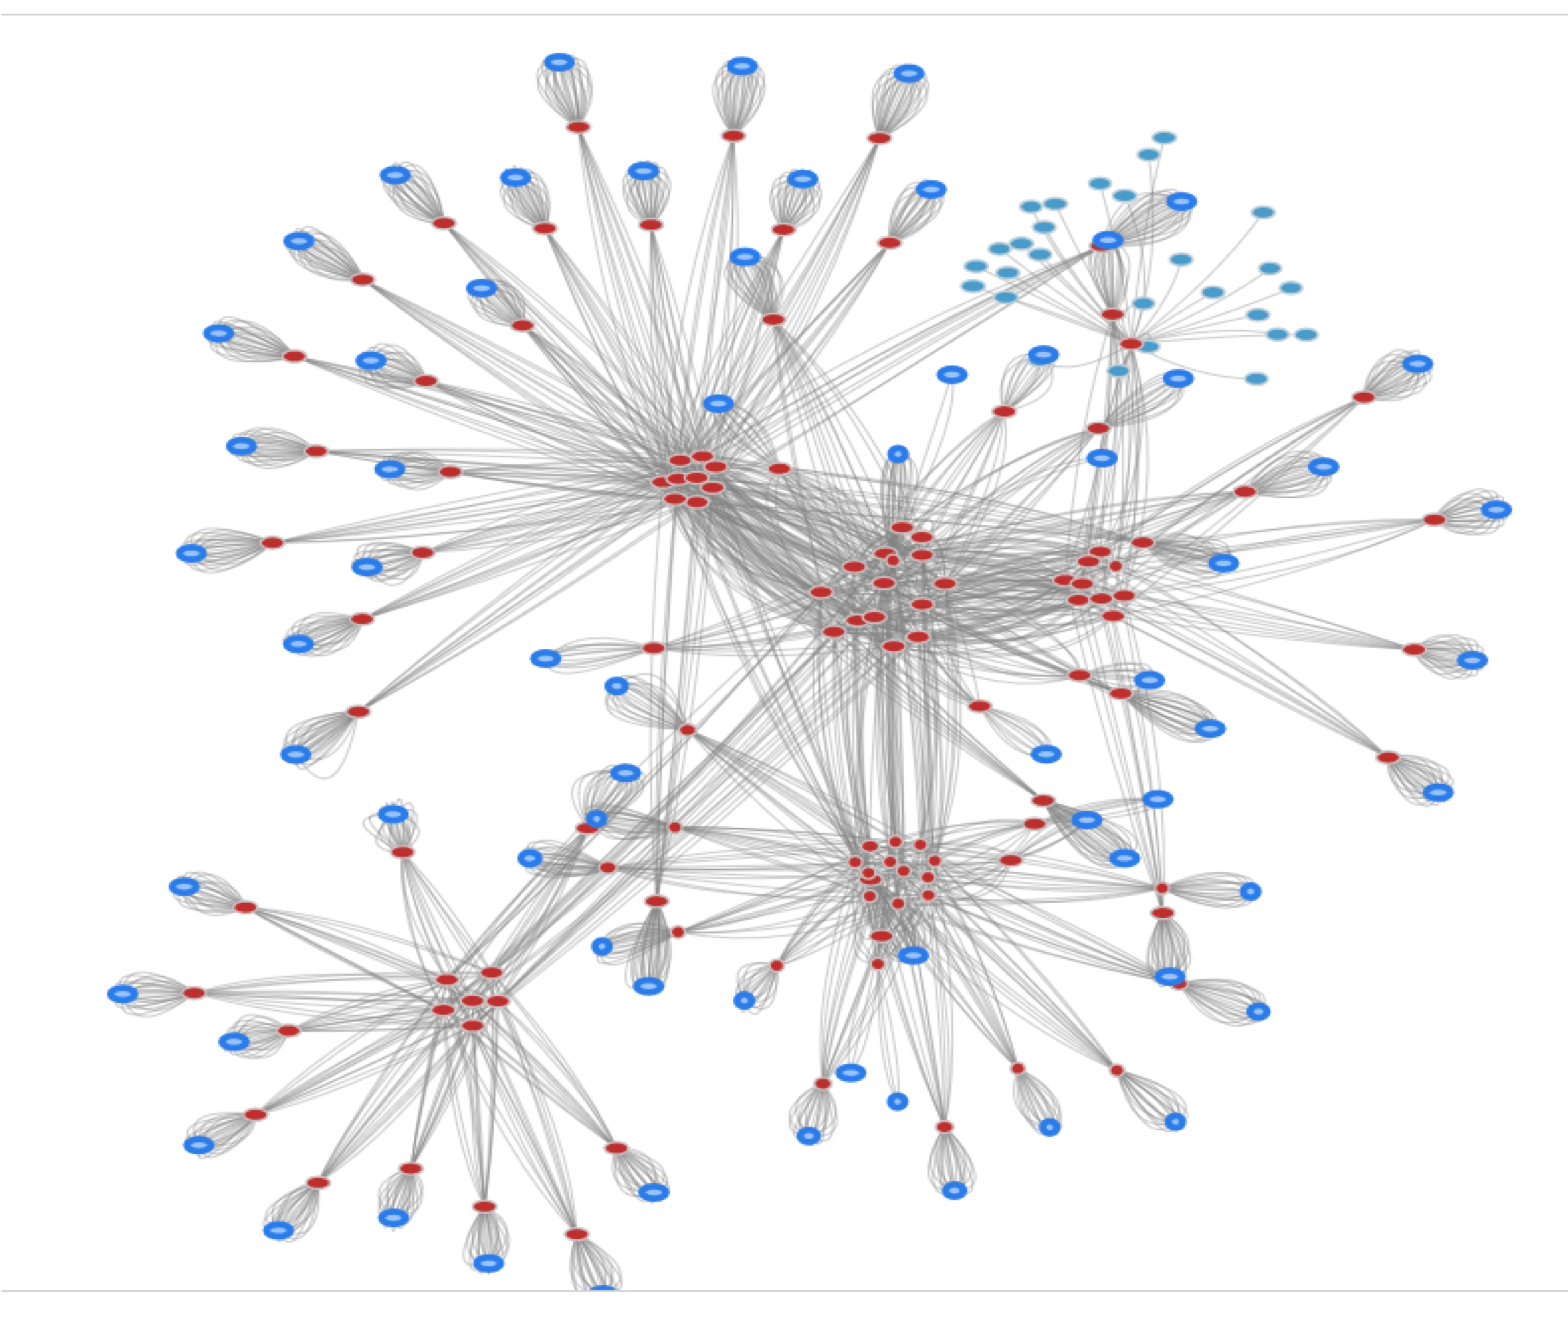
Network view of Frontera cluster with hidden compute nodes - 8,811 nodes, 494 switches, 22,819 network links
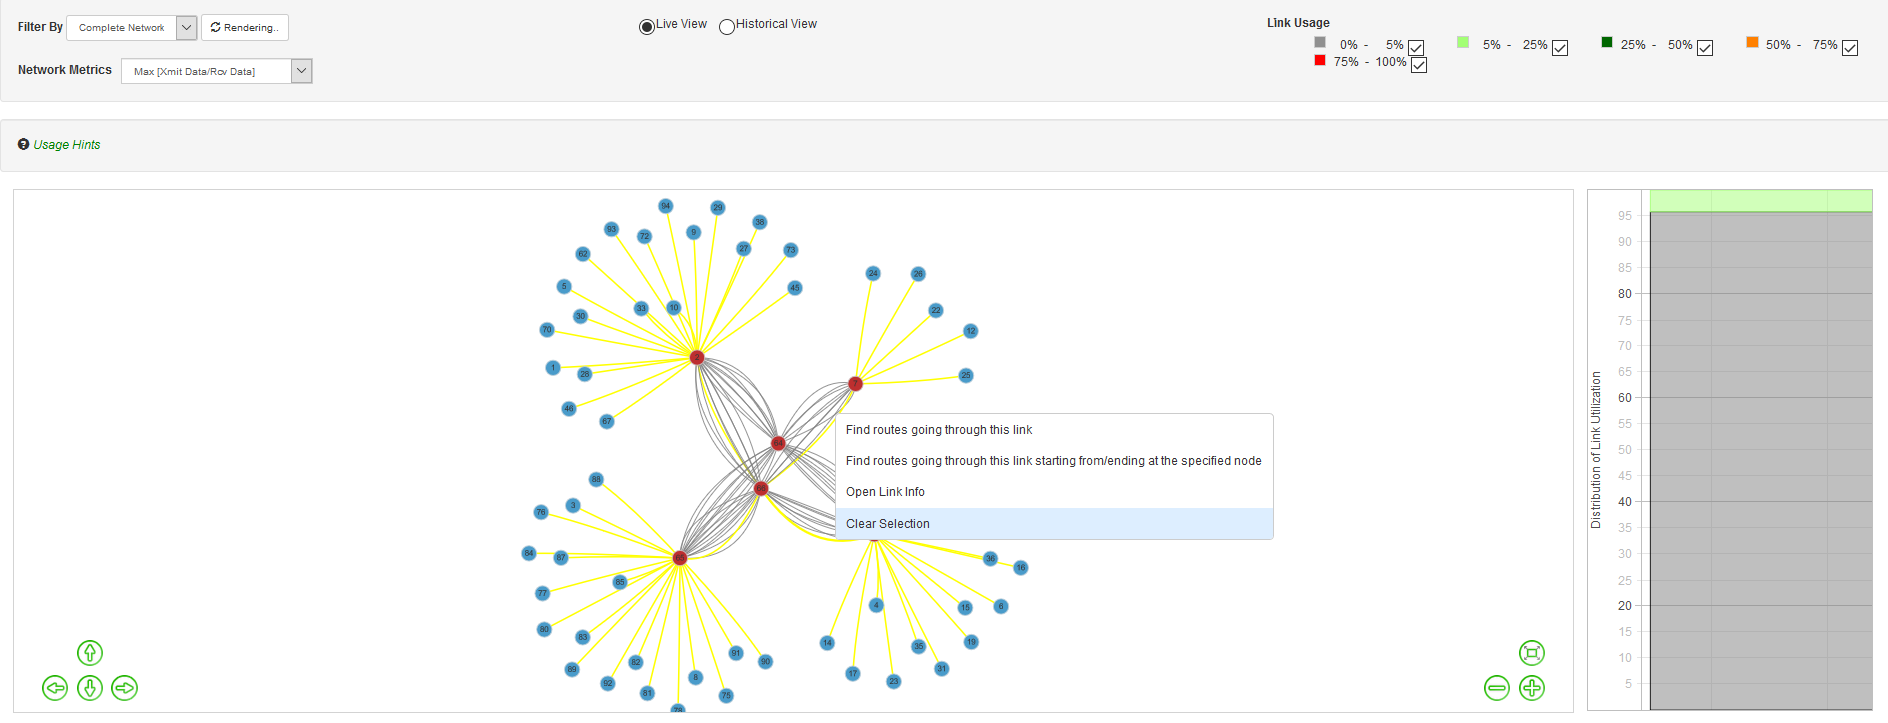
- Network view - RI2 cluster @ OSU
- Capability to look up the list of nodes communicating through a network link
- Capability to classify data flowing
over a network link at job level and process level granularity in
conjunction with MVAPICH2-X 2.2rc1
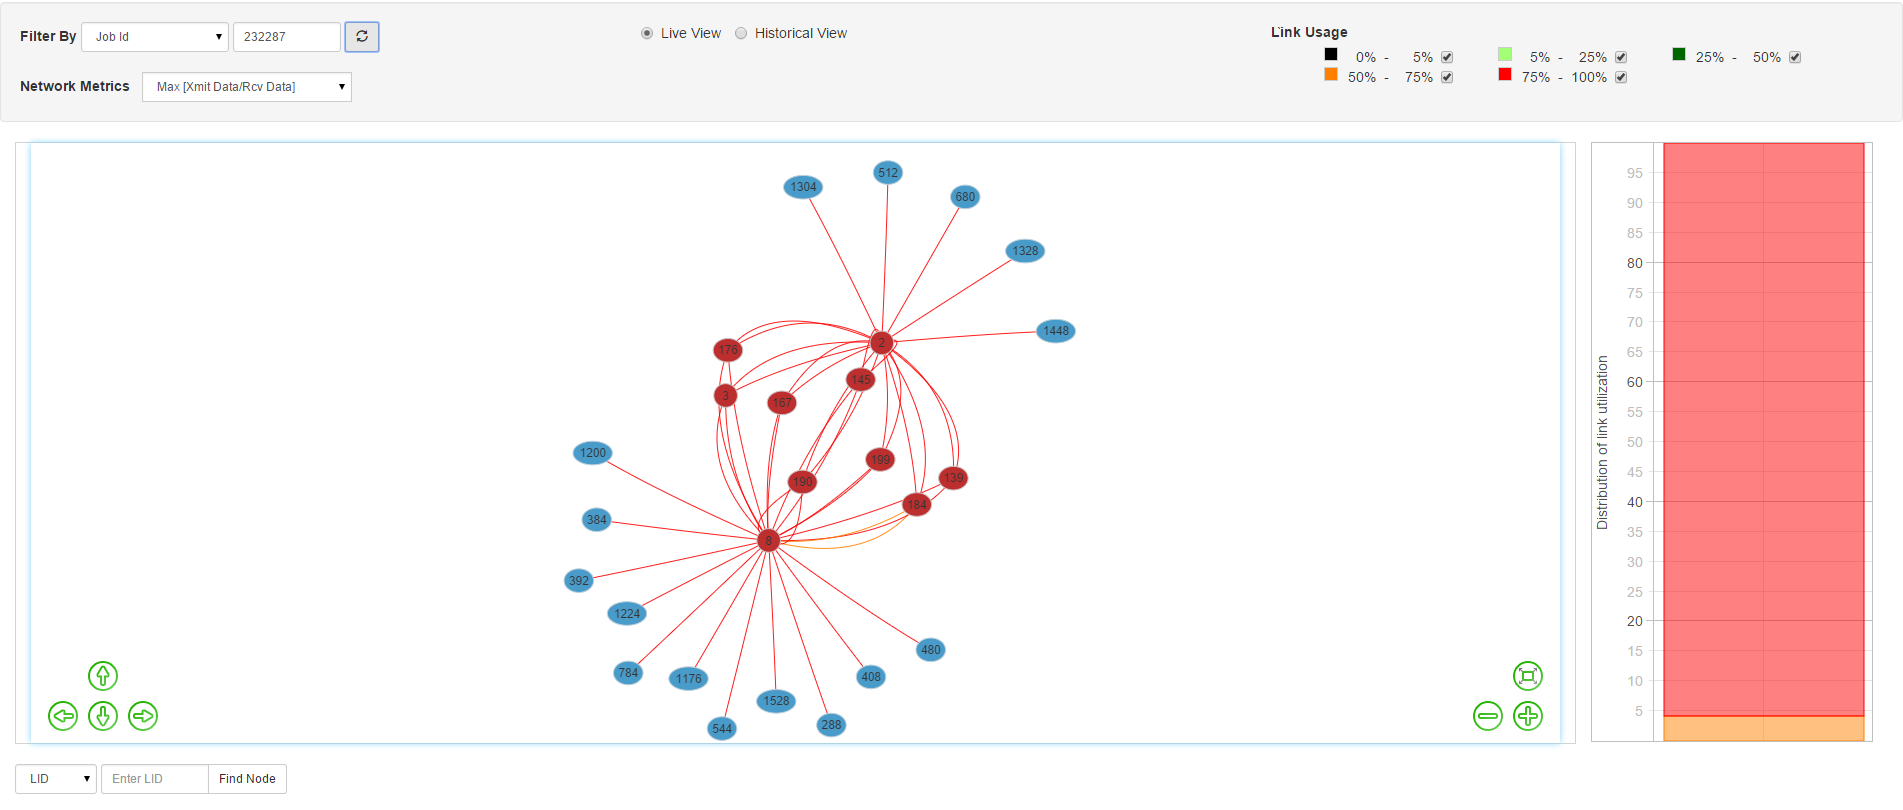
- Link Utilization at Network Level - Absolute View
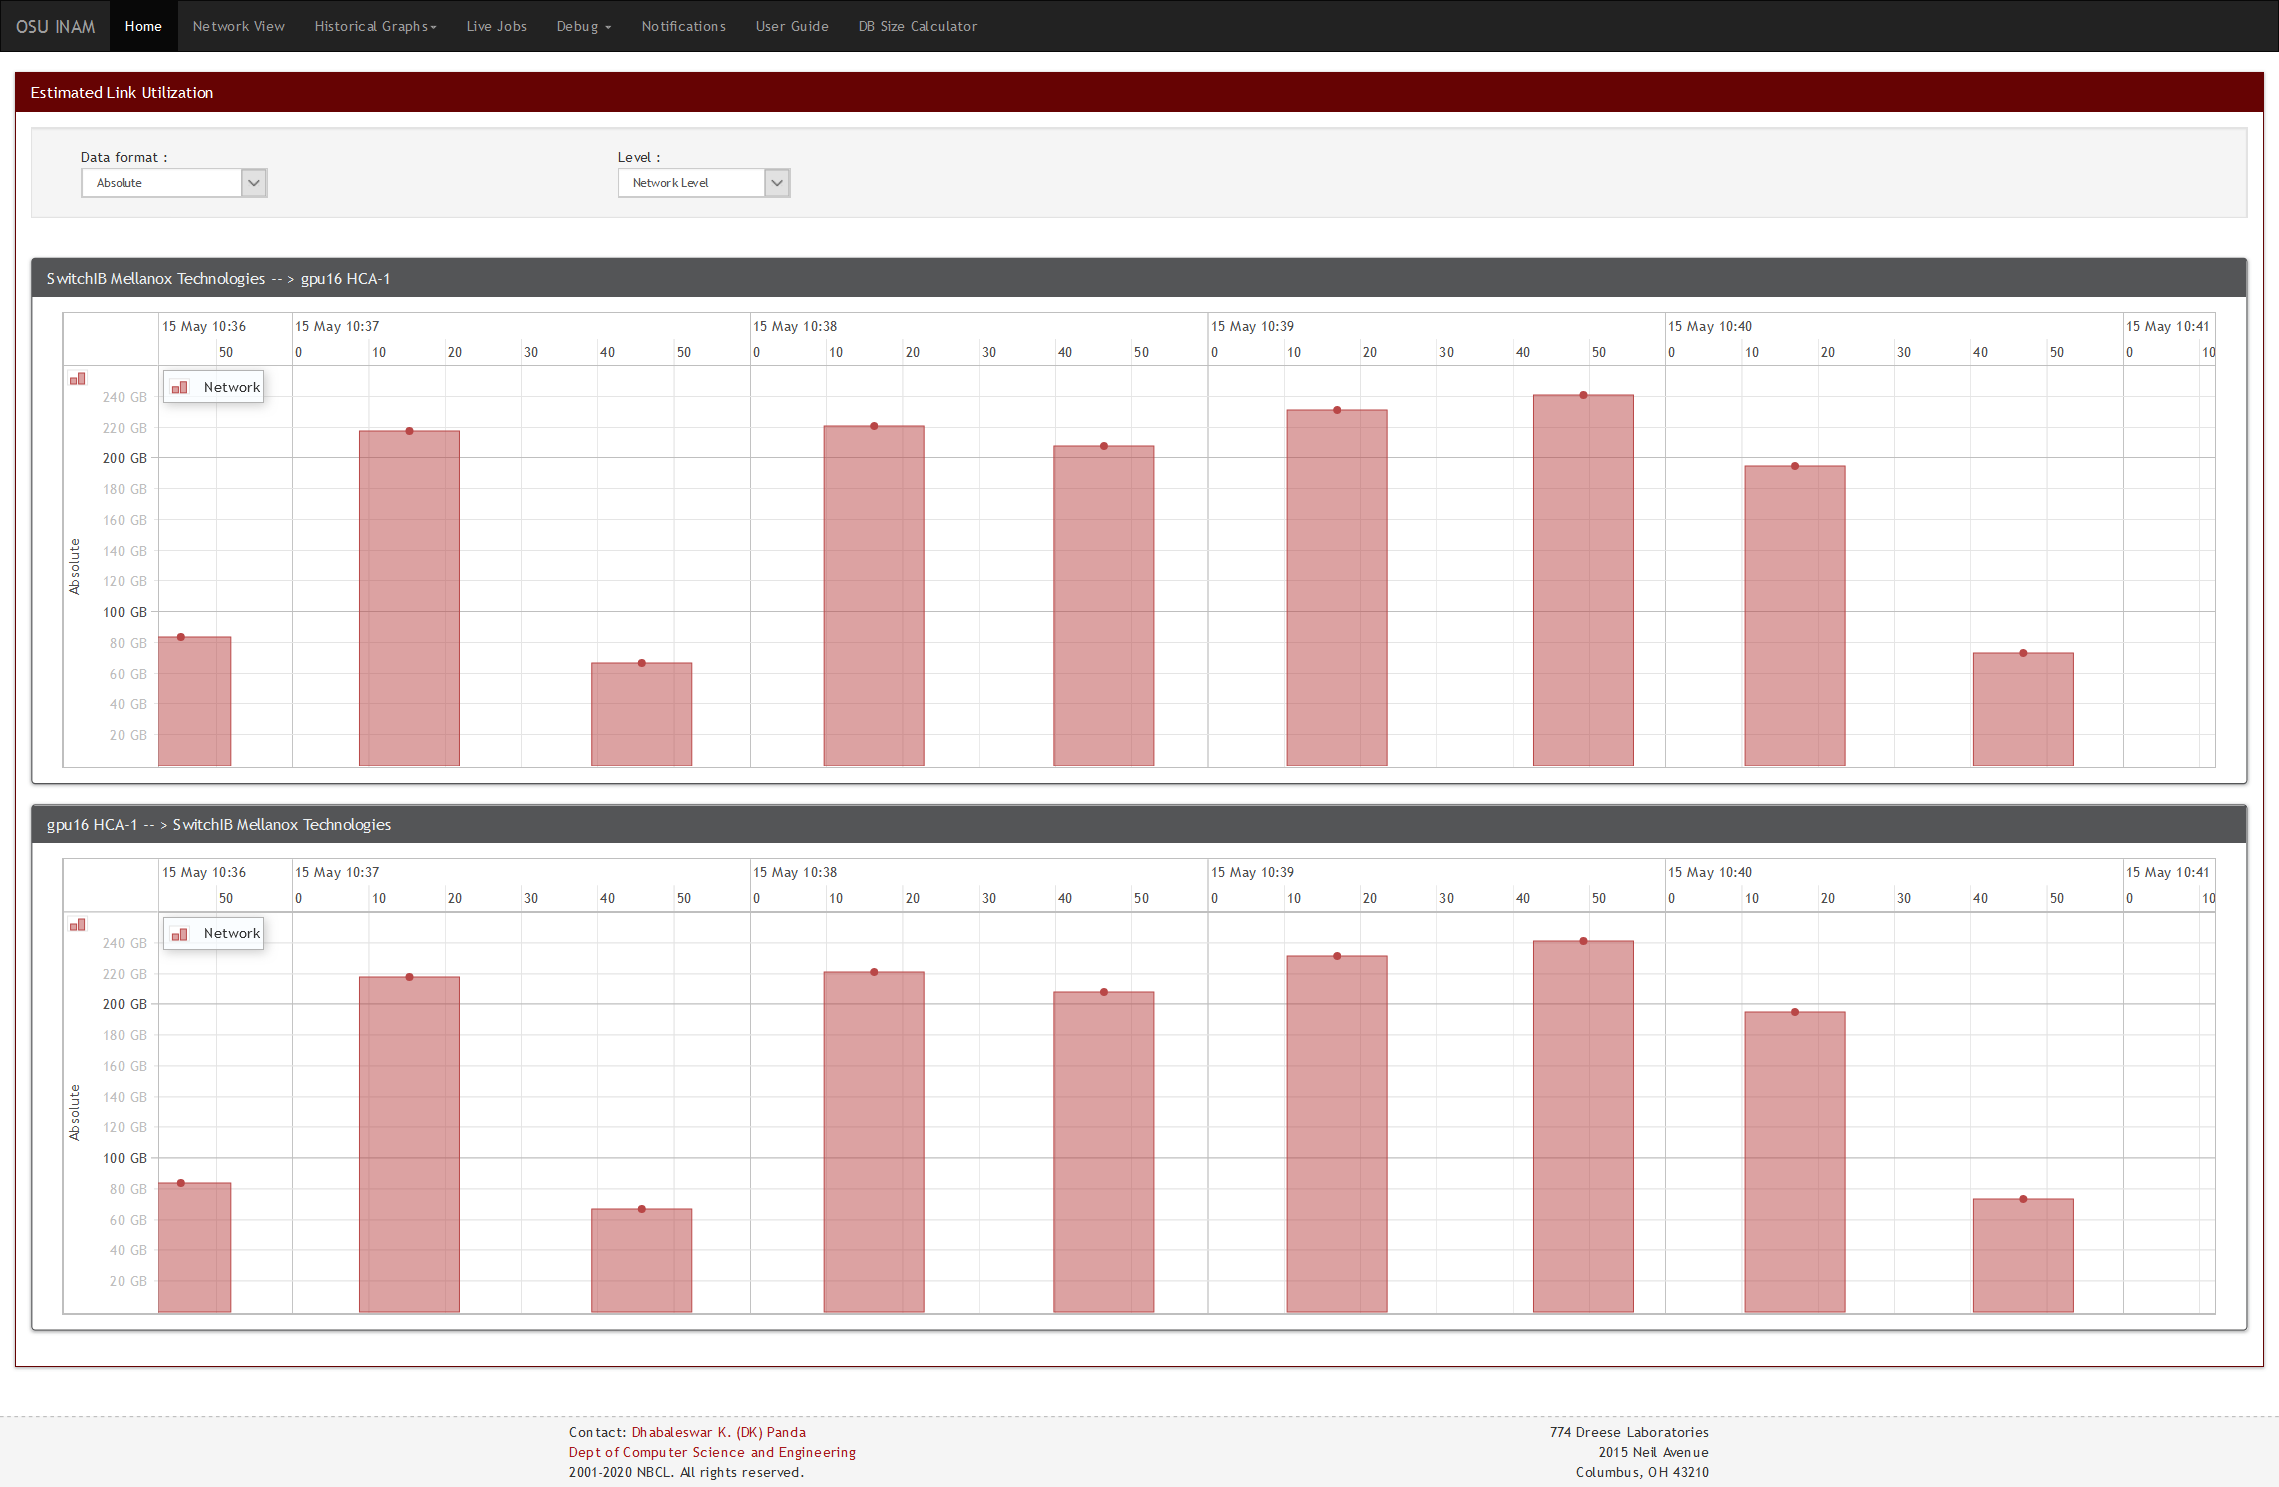
View the link utilization between two nodes
- Link Utilization for Job level - Absolute View
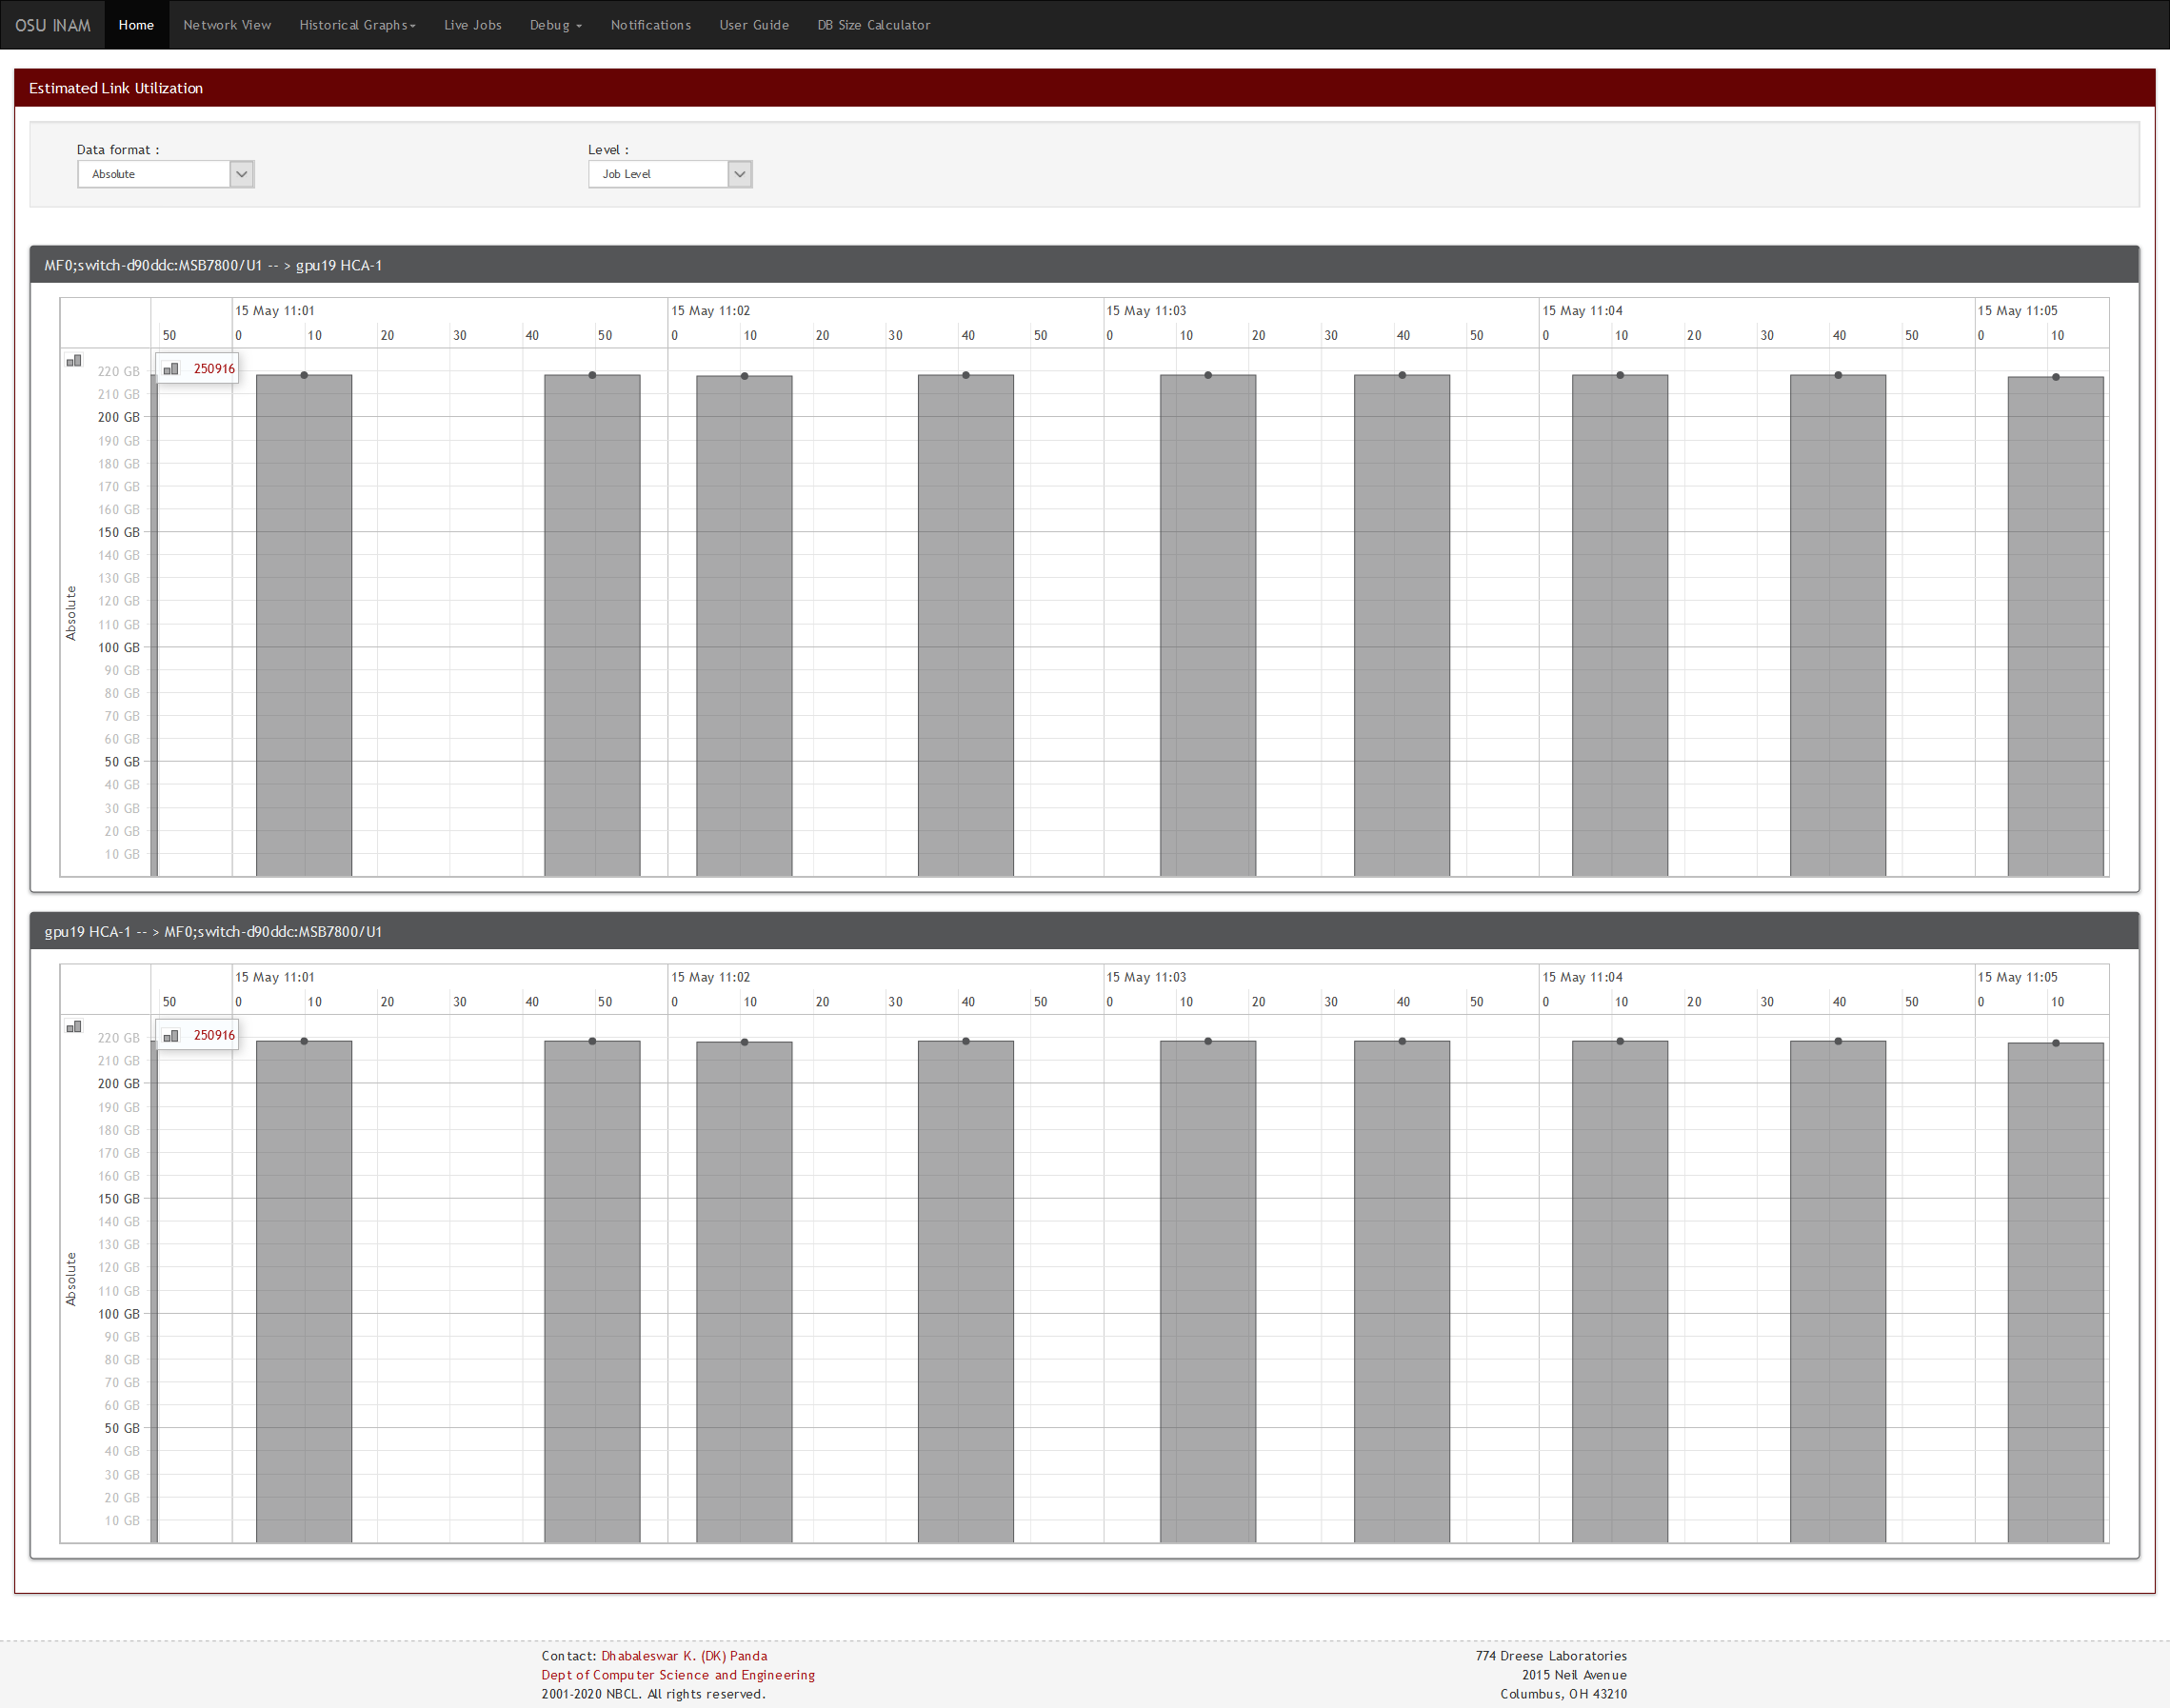
View the link utilization by the jobs sending/receiving data through it.
- Link Utilization at Job Level - Relative View
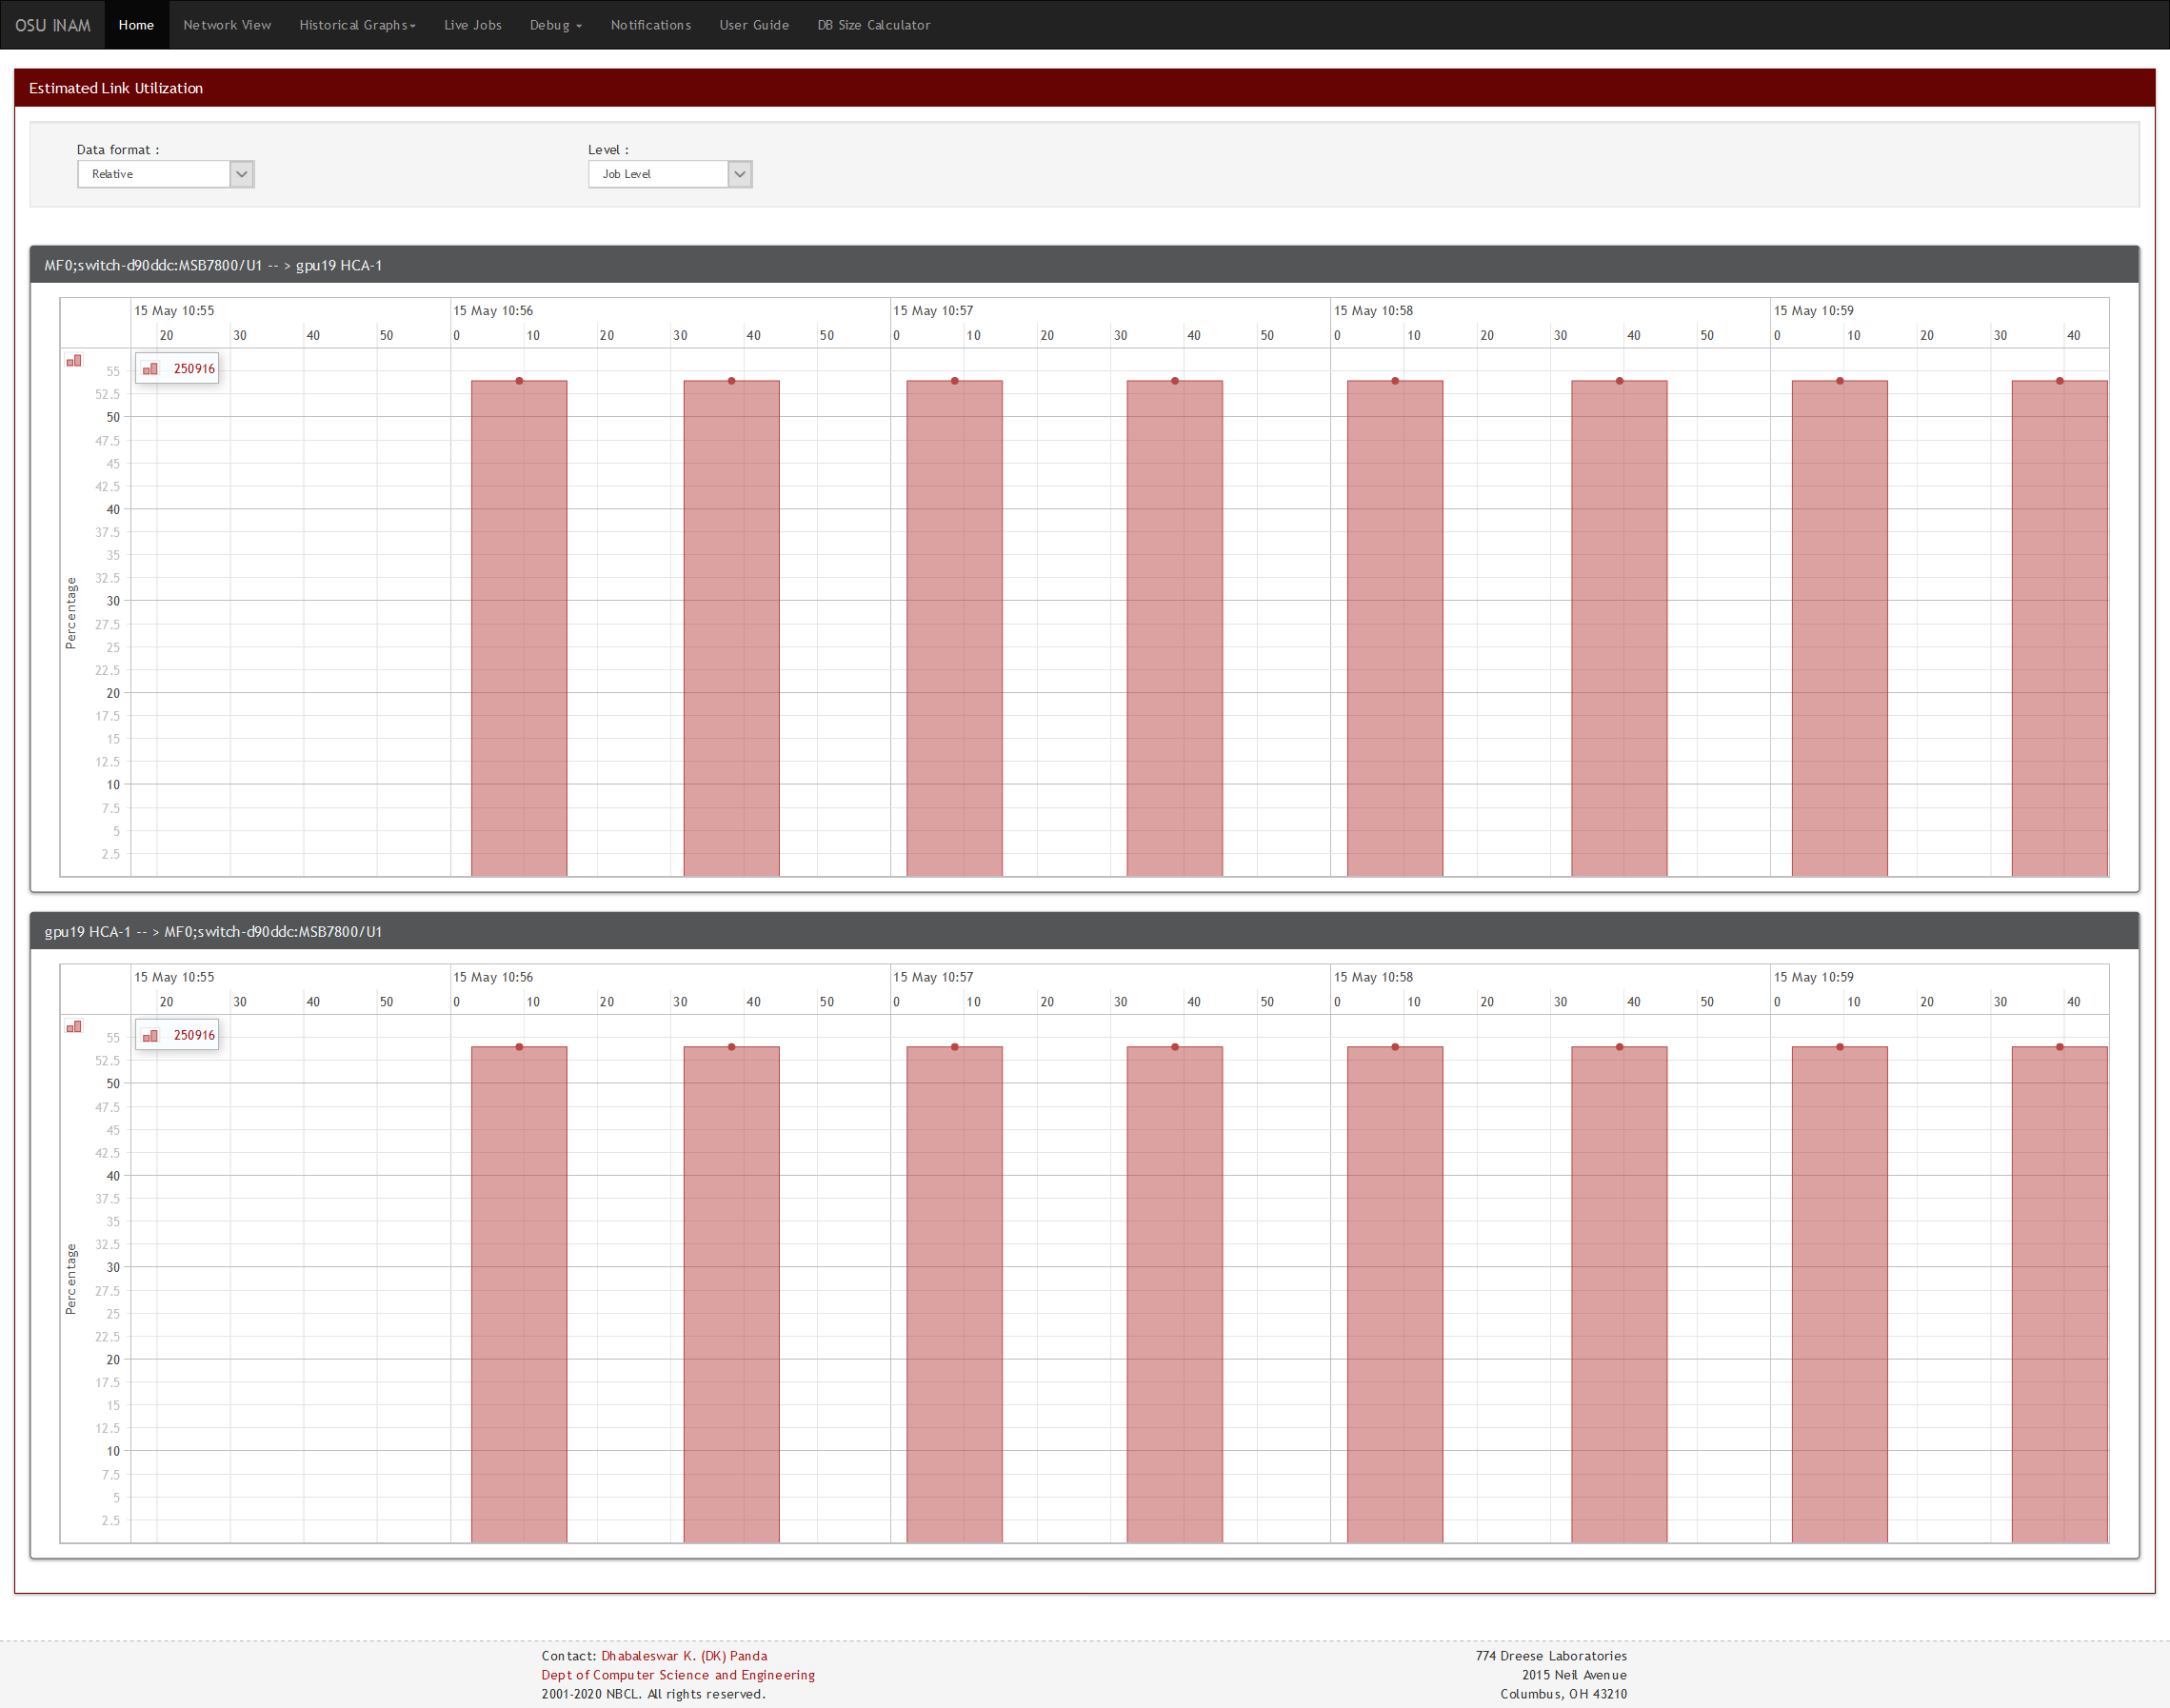
View the contribution of a job to the link's traffic in percentage.
- Link Utilization at Process Level
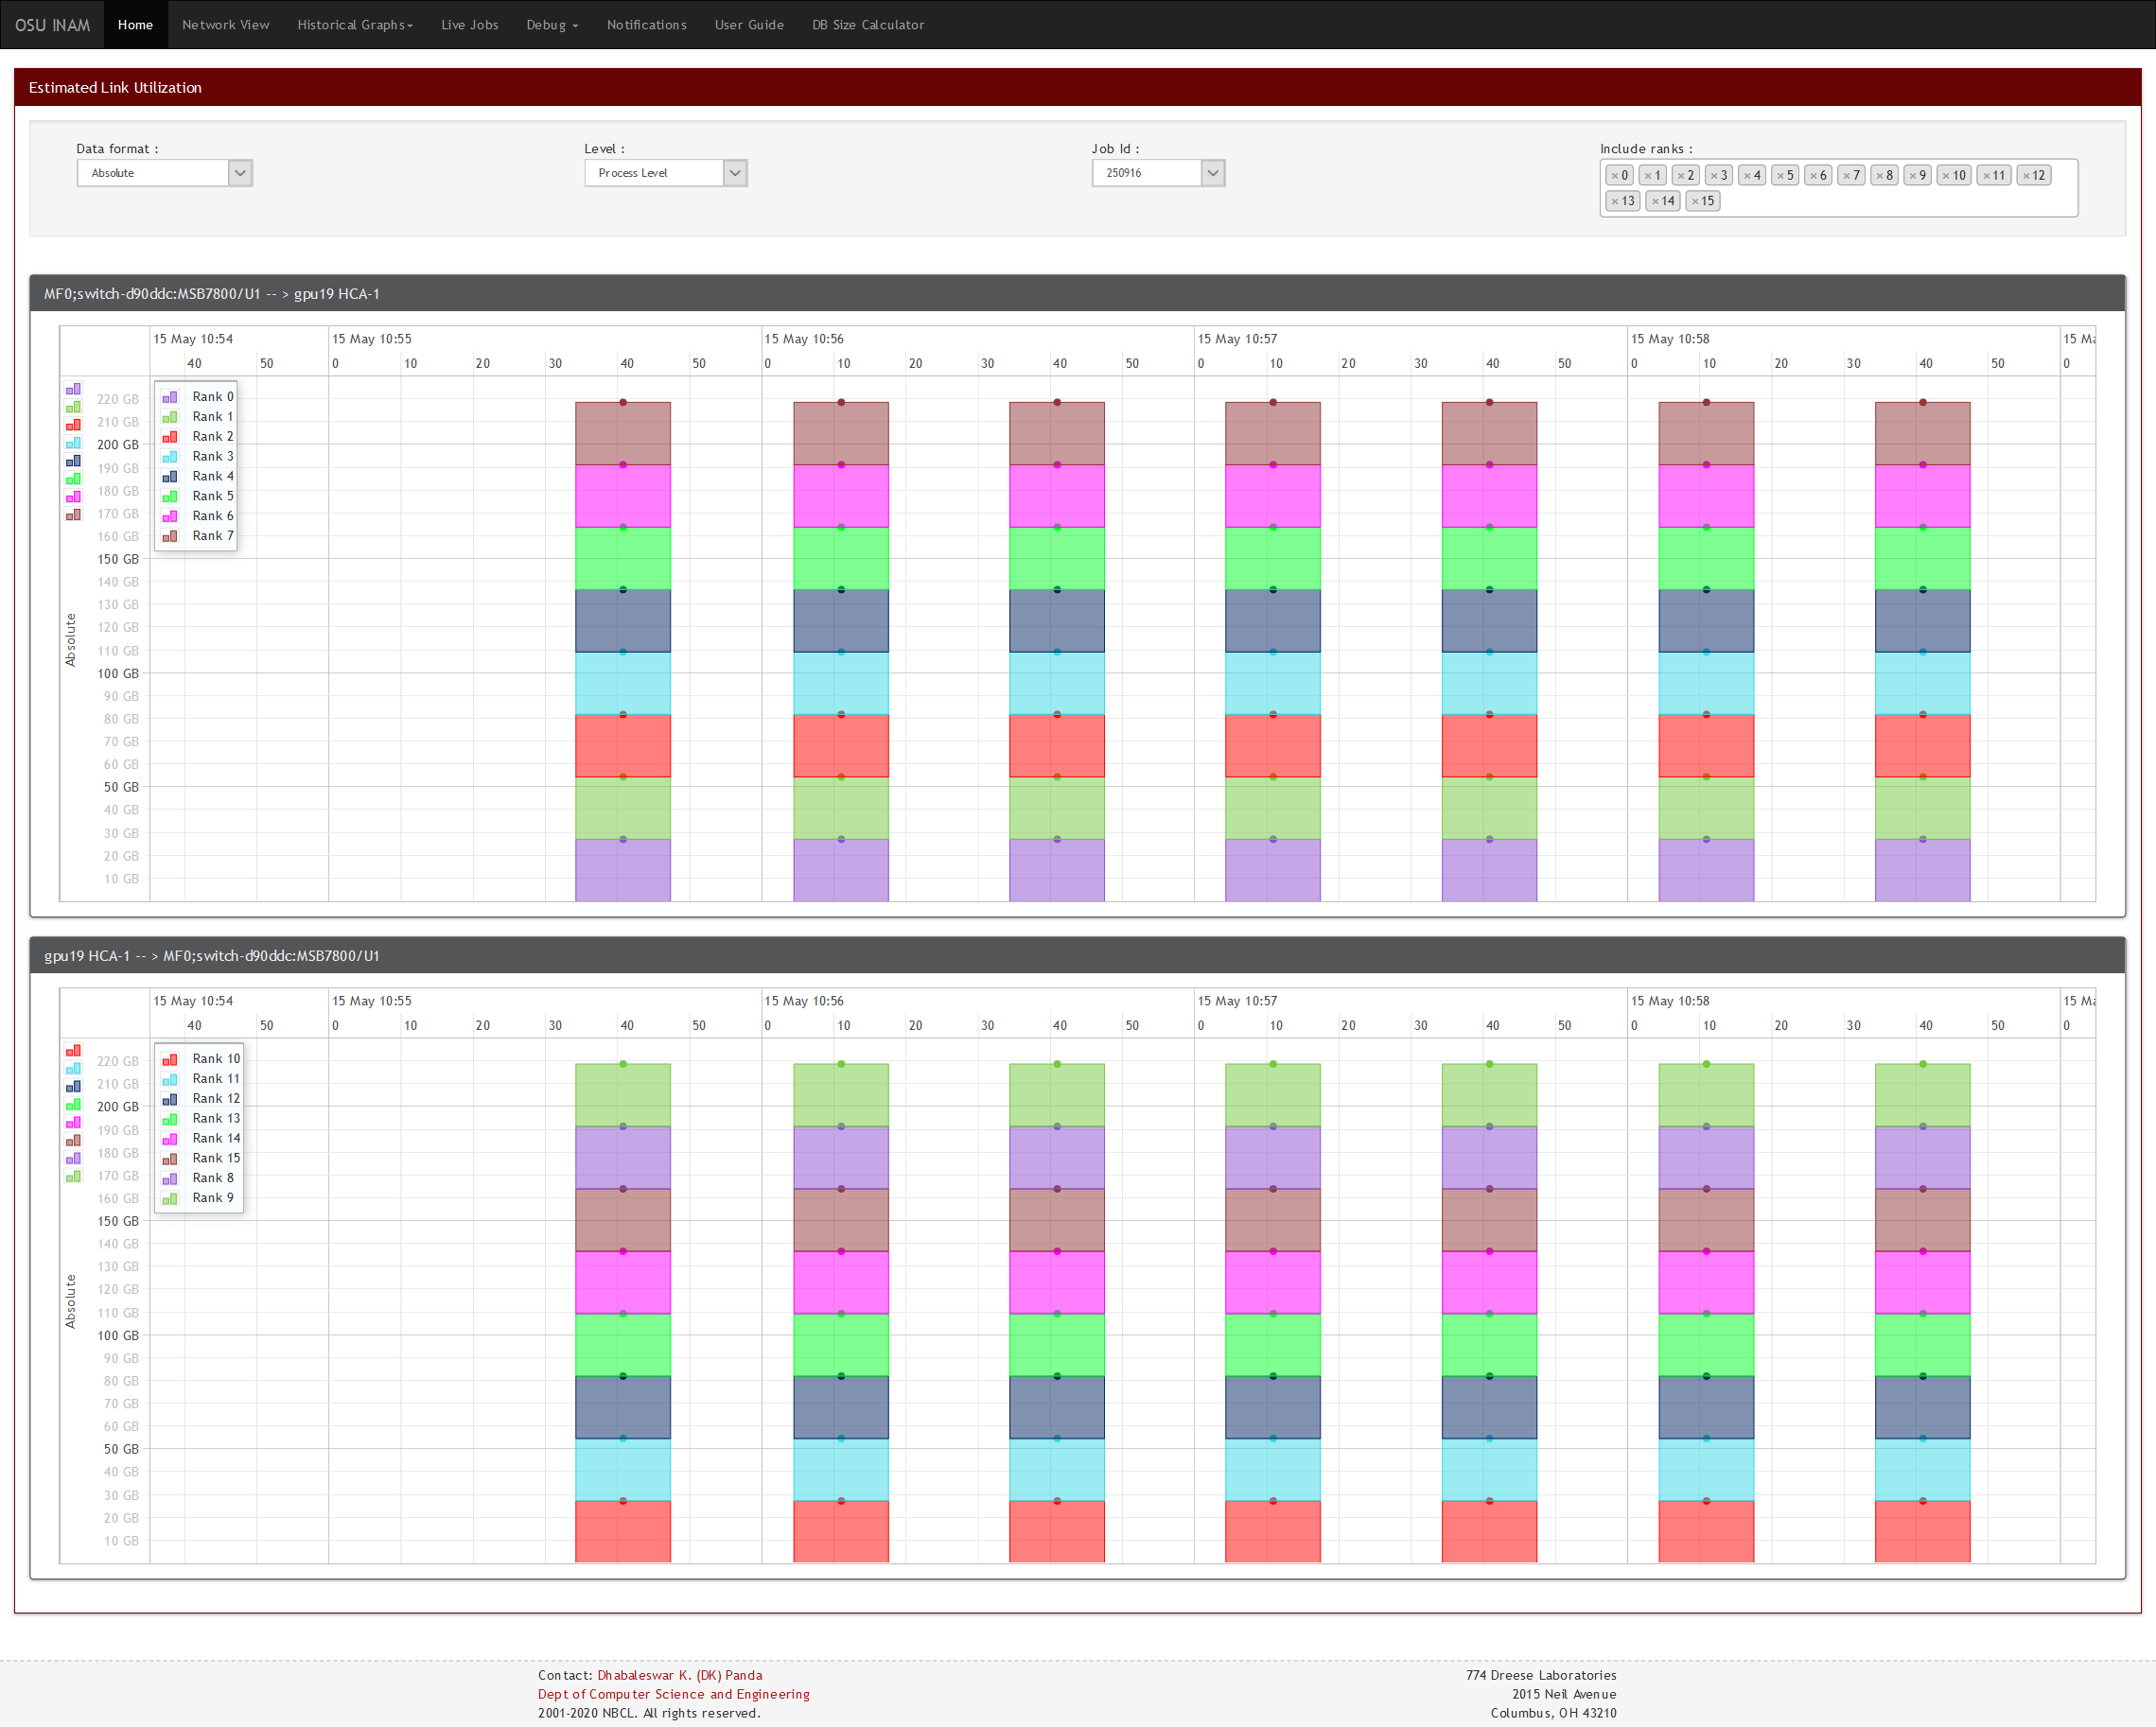
By selecting a job id, process level link utilization for that job is shown.
- Link Utilization at Network Level - Absolute View
- Capability to profile and report the process to node communication matrix for MPI processes at user- specified granularity in conjunction with MVAPICH2-X 2.2rc1
- Visualize the data transfer happening in a "live" fashion for
- Capability to visualize data transfer that happened in the network at a
time duration in the past for
- Entire Network - Historical Network Level View
- Particular Job - Historical Job Level View
- One or multiple Nodes - Historical Node Level View


